
******** UNDER CONSTRUCTION ***************
Descriptive statistical exploration of the IViE corpus
This page provides descriptive statistics on average f0, the standard deviation of f0 and the speaking range (difference between average minimum and average maximum) in the IViE corpus. The data illustrate variation conditioned by speaker, gender, style (read sentences, read text, retold text, map task, free conversation) and urban dialect (London, Cambridge, Leeds, Bradford, Newcastle, Belfast, Dublin).
The following graphs illustrate the data. Tables giving the values are available
here.
Figure 1 shows mean fundamental frequency values for male and female speakers in the entire corpus (36 hours of speech), averaged over dialects and speaking styles (54 male and 54 female speakers). The data were obtained by running an f0 tracker on each file (get_f0 from the xwaves/ESPS package) and then averaging the results over all voiced regions.
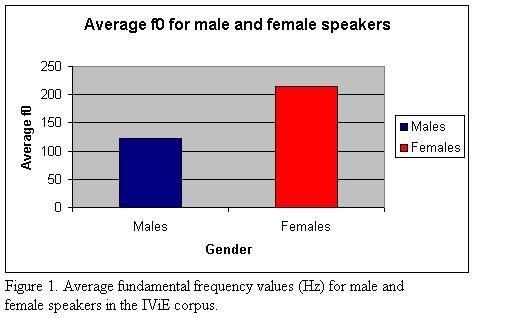
Figure 2 shows average fundamental frequency ranges for male and female speakers. The figure shows average minima and maxima for male speakers
on the left and for female speakers on the right. The range is defined as the distance between average f0 maxima and average f0 minima. Maxima and
minima were calculated for each file in the corpus.
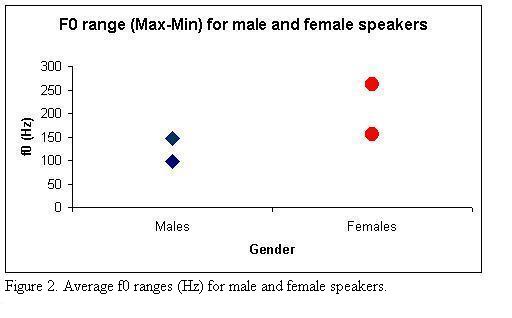
Figure 3 shows average fundamental frequency values for male and female speakers
from each dialect.
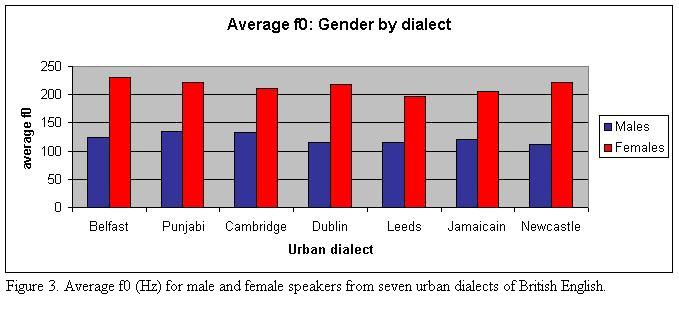
Figure 4 shows average fundamental frequency ranges for male and female speakers by dialect. The figure shows that in the Belfast data, male and female ranges were higher than in the data from the other dialects. Overlap between male and female ranges was observed in Cambridge but not in the other dialects.
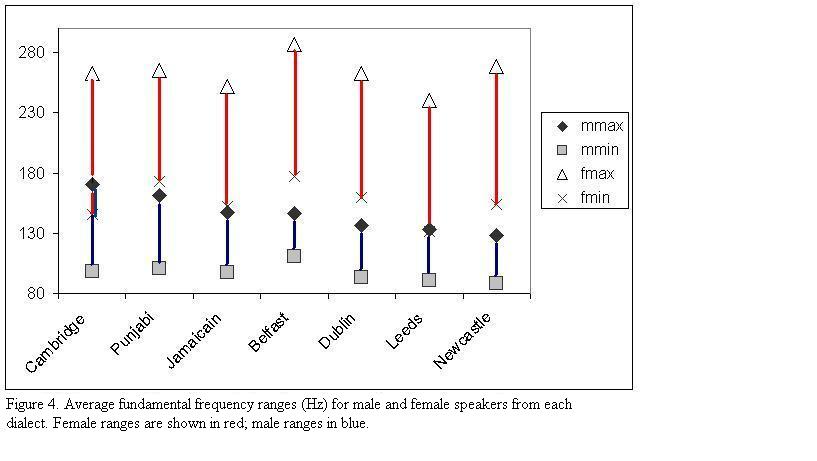
Figure 5 illustrates the effect of speaking styles on average f0. For female speakers, average f0 is highest in read sentences and lowest in retold speech. The difference can involve as much as 20 Hz. Male speakers produced the highest
values in the sentences and in the map task and the lowest values in the conversations. The data do not support a separation into read speech (sentences, text) and spontaneous speech (retold, map, conversation) or non-interactional (sentences, map, conversation)and interactional speech (map, conversation). Rather, it appears that each speaking style is associated with a particular average f0.
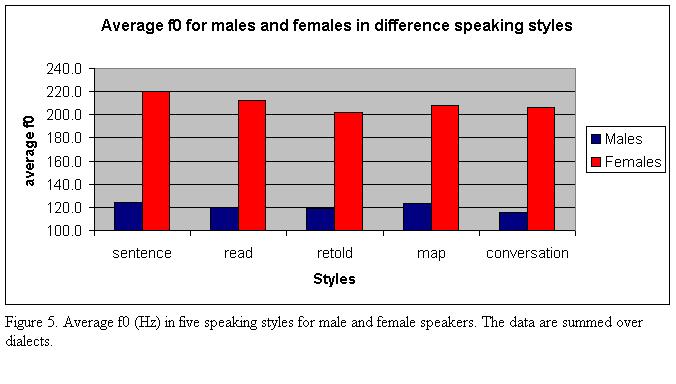
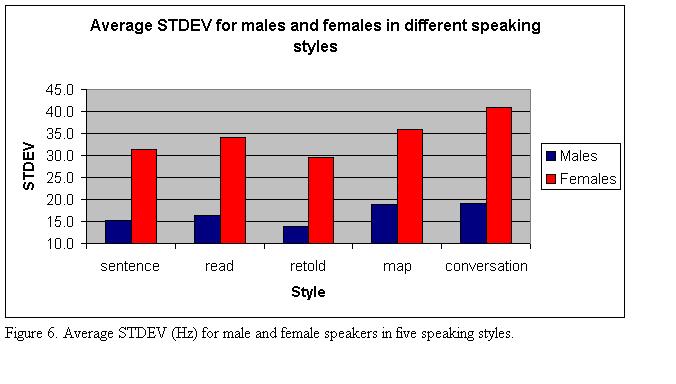
Figure 6 illustrates the effect of speaking style on the standard deviation. The pattern shown holds for males and females. The STDEV splits the data into interactive speech on the one hand and read sentences and retold speech on the other. The read texts (a fairy tale) were produced with STDEV values as high as those produced in interactive speech.
Note, however, the following: average f0 and STDEVs for sentences, read texts and retold speech are based on data from individual speakers. Values for interactional styles (map task and conversation) are based on data from speaker pairs. Consequently, we took the following steps:
1. The same pairs of speakers took part in the map task and in the conversations. For each pair, We calculated corresponding values from the sentence data, the read text and the retold speech data.
2. For the interactive styles, we considered three scenarios:
1. Speakers do not adapt their f0 behaviour to that of the other speaker: No Adaptation.
2. Speakers fully adapt their f0 behaviour to that of the other speaker: Full Adaptation.
3. Speakers adapt their f0 behaviour somewhat to that of the other speaker: Half Adaptation.
The following graphs show average f0 and STDEV values for the five
styles from speaker pairs. Figure 7 shows raw values. Figure 8
shows values for the non-interactive styles corrected for No Adaptation.
Figure 9 shows Full Adaptation and Figure 10 shows Half Adaptation.
----INSERT FIGURES 7-9------------